
published in: IRIS Universe (summer, 1988)
Creatures of the Complex Plane
Jeffrey Ventrella

Abstract Biogenetics
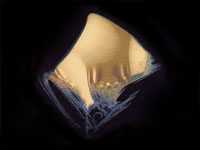
Aside from the sculptural aspect of iteration, fractal functions may be thought of as genetic codes determining the anatomies of the shapes. While exploring the inner-workings of a function and finding interesting alterations one may get a sense that he or she is unravelling the DNA helix. To me it is an artform of abstract biogenetics, and the IRIS serves as an elaborate petri dish. Fractalizer Peter Oppenheimer of the New York Institute of Technology and others promote such analogies of fractal art to biological creation.1. For the artist working with fractals such as the Mandelbrot set, a new method of crafting visuals becomes apparent: the organization and beauty of the forms are not entirely creations of the artist. With practically no visual manipulation aside from the actual techniques of display, fractals seem to have a life of their own. But a computer artist may wish to inject a personal style into the forms to coincide with the already stunning imagery that exists by default. This may be done by "tweaking the parameters", either with clearly defined mathematical transformations or with more subjective, "amathematical" techniques.
The Tool
These deformations of the Mandelbrot set are explained from the standpoint of a visual thinker concerned with the manipulation of pre-existing imagery. To begin, as stated, the Mandelbrot function is the mathematical tool for carving out this well-known fractal form. One may also think of any alteration of this function as a tool for generating other fractals. This has been done to an extent by mathematicians and artists interested in illustrating complex dynamics or exploring new fractal aesthetics. Thomas Papathomas and Bela Julesz of AT&T Bell Labs have animated deformations of the set as a part of their research in human visual perception of motion and depth.2. The present approach is to a great extent amathematical: the method of generating the images relies more on intuition and a visual sense than on any clear-cut mathematical concept. Still, a description of the logical starting point for this technique may help in describing how the images came about.
The Mandelbrot Set is defined as the set of all locations C in the complex plane in which Z remains finite during the recursive operation:
Zn+1 = Zn2 + C
where Z and C are complex numbers, and Z0 = 0. C serves as a constant which represents
a location in the complex plane being tested. In short, each C in a given window of
the plane is used in the function, which is iterated a given number of times.
The final state of Z after n iterations determines whether that location C is in
the set or not. A more thorough description of the generation of the set may be
found in Dewdney (1987, 1985), Peitgen and Richter (1986), and Mandelbrot (1983),
among many others. Techniques for colorizing images of the set may be based on
information such as the number of iterations it took Z to exceed a certain magnitude
for each location, or the actual value of Z after n iterations. The former is a
standard way of displaying the set but both are used in the present treatment,
including other methods based on the nature of the series of Z's created by the
process.
In my program, the key parameters used as genetic "tuning knobs" of the Mandelbrot set are actually real number variables in an expression of the function with its real and imaginary parts separated:
      Zrn+1 = Zin2 -  Zrn2 + Cr
      Zin+1 = 2 Zrn   Zin  + Ci
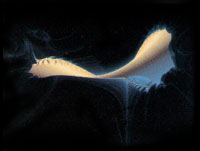
The first of the Mandelbrot set's "freaky others" I discovered was the result of
changing the 2 in the second line to -2. This seemingly small change transforms
the set into a creature having a distinct 3-fold symmetry and exhibiting
complexity only at its extremities. One of the first discoveries made:
it is possible to generate shapes in which the fractal parts (the complex,
fuzzy areas) are shifted to occupy distinct localized areas or configurations.
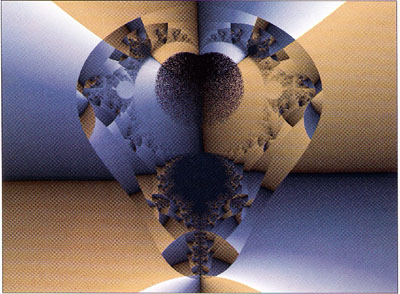
More varieties of manipulation are made possible by attaching tiny tuning knobs to the eight variables in the example. For instance, the Zr could be expanded to Zr+t, or Zr/t, etc. with t being any small fraction entered interactively. I'll leave the description open-ended at this point since any further variations one might try would be subject to a particular programming or artistic style.
In experimenting with these genetic tuning knobs, you might soon get a sense of the Mandelbrot Set as a piece of mathematical rubber, but a unique kind of rubber subject to the properties of the complex plane. To me, the complex plane is a rich ground for poetic exploration. The mathematical explanations behind most of the poetry came only as an afterthought. And for this reason, the math was revealed in a more beautiful and metaphorical way than it could have been otherwise. This is the way some people like to learn mathematics.
Two and a half dimensions
The third dimension is the IRIS workstation's specialty. It is designed to be proficient at performing transformations in 3D, and fast. While superworkstations like the IRIS are bringing the 3 dimensions of Euclid down to a hardware level, non-euclidean geometries such as fractals are giving rise to new methods of image-making that don't necessarily follow the rules of standard geometry. Fractal objects can have dimensions which lie between whole numbers.
These images suggest illusionism and depth, but they do not involve any use of IRIS 3D geometry, as do the beautiful landscapes by Dietmar Saupe. (see last issue of the IRIS Universe). This illusionism is suggested by utilizing the smooth gradations created by mapping these functions. The gradations can be interpreted as topographies of three-dimensional surfaces, as D. Saupe has done. It is provocative to compare the Z in these mappings (especially as existing inside the set) to the Z-axis of three-dimensional space. But in these examples, the analogy is expressed as pure color. I prefer to keep this analogy loose, for the same reason that painters of the Modernist tradition often provoke a tension between two-dimensionality and illusion.
In actual practice these pictures are generated on a two-dimensional cartesian plane, but in appearance, and also in theory, the dimensions are quite fuzzy. You could say that these images are examples of two-and-a-half dimensional computer art.
Technique
Although no use of IRIS 3D functions were used, the whole technique would not have been made possible without the sheer display speed and interactivity the IRIS offers. This kind of technique requires constant visual evaluation of parameter inputs. Given control over time-consuming factors like picture resolution and the number of function iterations, a workable image can be generated in a matter of seconds. After literally hundreds of trials and changes involving tweaking parameters, running new colormaps, and adjusting pans and zooms, things like resolution and iterations can then be jacked-up for the final running of the image. It is then ready for the camera (a 35mm camera on tripod, with low ASA print film, and shutter speed set at about one second).
What this discussion may illuminate for those already familiar with fractal art is a divergent way of approaching the Mandelbrot set. Most other treatments involve magnifying very remote areas of its boundary and then applying wild colorations to the image. This approach does not interpret the Mandelbrot set literally. It begins with the set as a biological creature, with a genetic code, a physiology, even a personality, to be manipulated (with mathematical intrigue but not rigor), and then displayed in its whole using naturalistic colors.
The Advanced Graphics Research Lab at Syracuse University
This work was produced on an IRIS 3020 at the Advanced Graphics Research Lab at SU, an all-campus research facility with an emphasis on image processing and data visualization. There have been recent developments in networking graphics applications, via fiberoptic cables, to the university's new Northeast Parallel Architectures Center, located on campus. Interfacing the IRIS with NPAC's Connection Machine will shortly open up new possibilities for further (and deeper) explorations with fractals in the complex plane.
footnotes
1. Oppenheimer, Peter from a presentation at Siggraph '87 and a paper in the course notes: The Modeling of Natural Phenomena, page 55
2. Papathomas & Julesz "Animation with fractals from variations on the Mandelbrot set" The Visual Computer 1987, pages 23-25 (the deformations of the set described in this article were done by varying the exponent in the function.)
