
(Attractiveness vs. Efficiency)
7 Results
In all simulations, swimbot count is initialized at 1000, and food count at 2000. Figure 5 illustrates swimbot and food population from the simulation over a span of 184900 time steps. Each vertical space is equal to 10000 time steps.
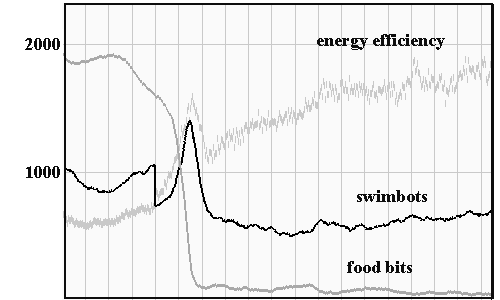
Figure 5. Swimbot vs. food population, superimposed with energy efficiency, from a typical simulation
The sudden drop in swimbot population at time 40000 is the result of surviving members of the first generation of swimbots dying of old age (swimbots are initialized at age 0, and cannot live longer than 40000 time steps).
The increase in swimmer population around 50000 is the result of swimbots multiplying in local regions, spreading out, and consuming large amounts of food, giving them energy to reproduce. Food population plummets as a result, followed by a decrease in swimbot population. Most simulations exhibit this characteristic spike.
The jagged light gray line indicates average energy efficiency in the population. This graph element uses a different scaling than population, and is superimposed to show correlation of efficiency with population dynamics. In most simulations run without mate preference, energy efficiency continues to rise for another 100000 to 500000 steps before leveling off.
Figure 6 shows 3 macroscopic views of the state of a typical simulation in which there is no mate preference.
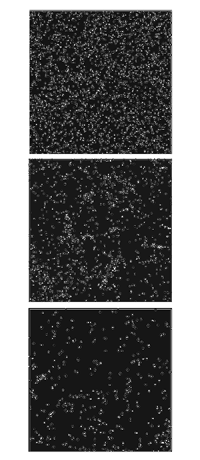
Figure 6. initialization, foraging, stasis
The states at time steps 0, 50000, and 100000 are shown. In the top panel, random swimbots and food bits are seen distributed randomly in the fluid. In the middle panel, local gene pools of swimbots have begun reproducing and foraging through regions rich in food, leaving food-sparse areas in their wake. The bottom panel represents the general appearance of the simulation after food and swimbot populations have become more stable. An exemplary swimming strategy which emerged from this simulation is illustrated in Figure 7.
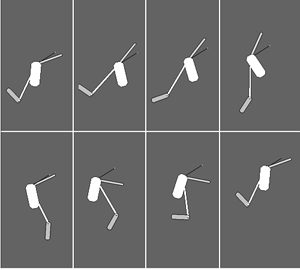
Figure 7. An evolved swimming strategy
The sequence is ordered from top-left to bottom-right. Each image in this illustration is separated by 4 time steps. It shows approximately one swim cycle. The swimbot is moving towards the upper-right. The two 'paddle' parts are responsible for most of the swimming work.
Preliminary Mate Preference Runs
In preliminary experiments, preferences were modeled with a genetically-inherited factor. These experiments were inspired by the work of Todd and Miller (91), whose model demonstrated how mate preferences can evolve to exploit existing phenotypic features. Each swimbot was given a 'favorite color' gene.
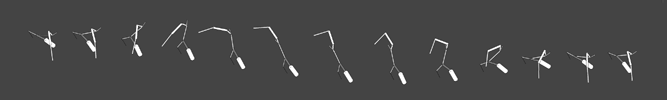
Figure 8. locomotion exhibiting 'open' features
When sizing up potential mates, swimbots would seek out those individuals having this color in any of their parts. And they were especially attracted if these parts were more massive, and moved more than any other parts encountered. The idea was to model a form of stimulus in which organisms respond simply to the amount of colored movement in their visual fields.
In running these simulations, it was hoped that such criteria would inhibit swimming performance. In simulations run with mate preference, isolated body parts became larger and exhibited more motion, as expected, yet energy efficiency increased at the same rate as simulations run without mate preference, and the population flourished. It appears as if mate preferences had evolved to exploit attractive features existing in swimbots who were already efficient swimmers. In fact, these attractive characteristics actually correlate with many efficient swimming strategies (of an aggressive, flamboyant nature).
8 Observations
